Solution
The solution was divided into two phases:
Phase 1: Enhancing the Existing Solution
Revamping the application and management system, incorporating desired technical improvements:
• Intuitive and user-friendly interface to streamline navigation and productivity.
• Performance optimization to ensure smoothness and reliability.
Phase 2: Strategic Dashboards for Decision-Making
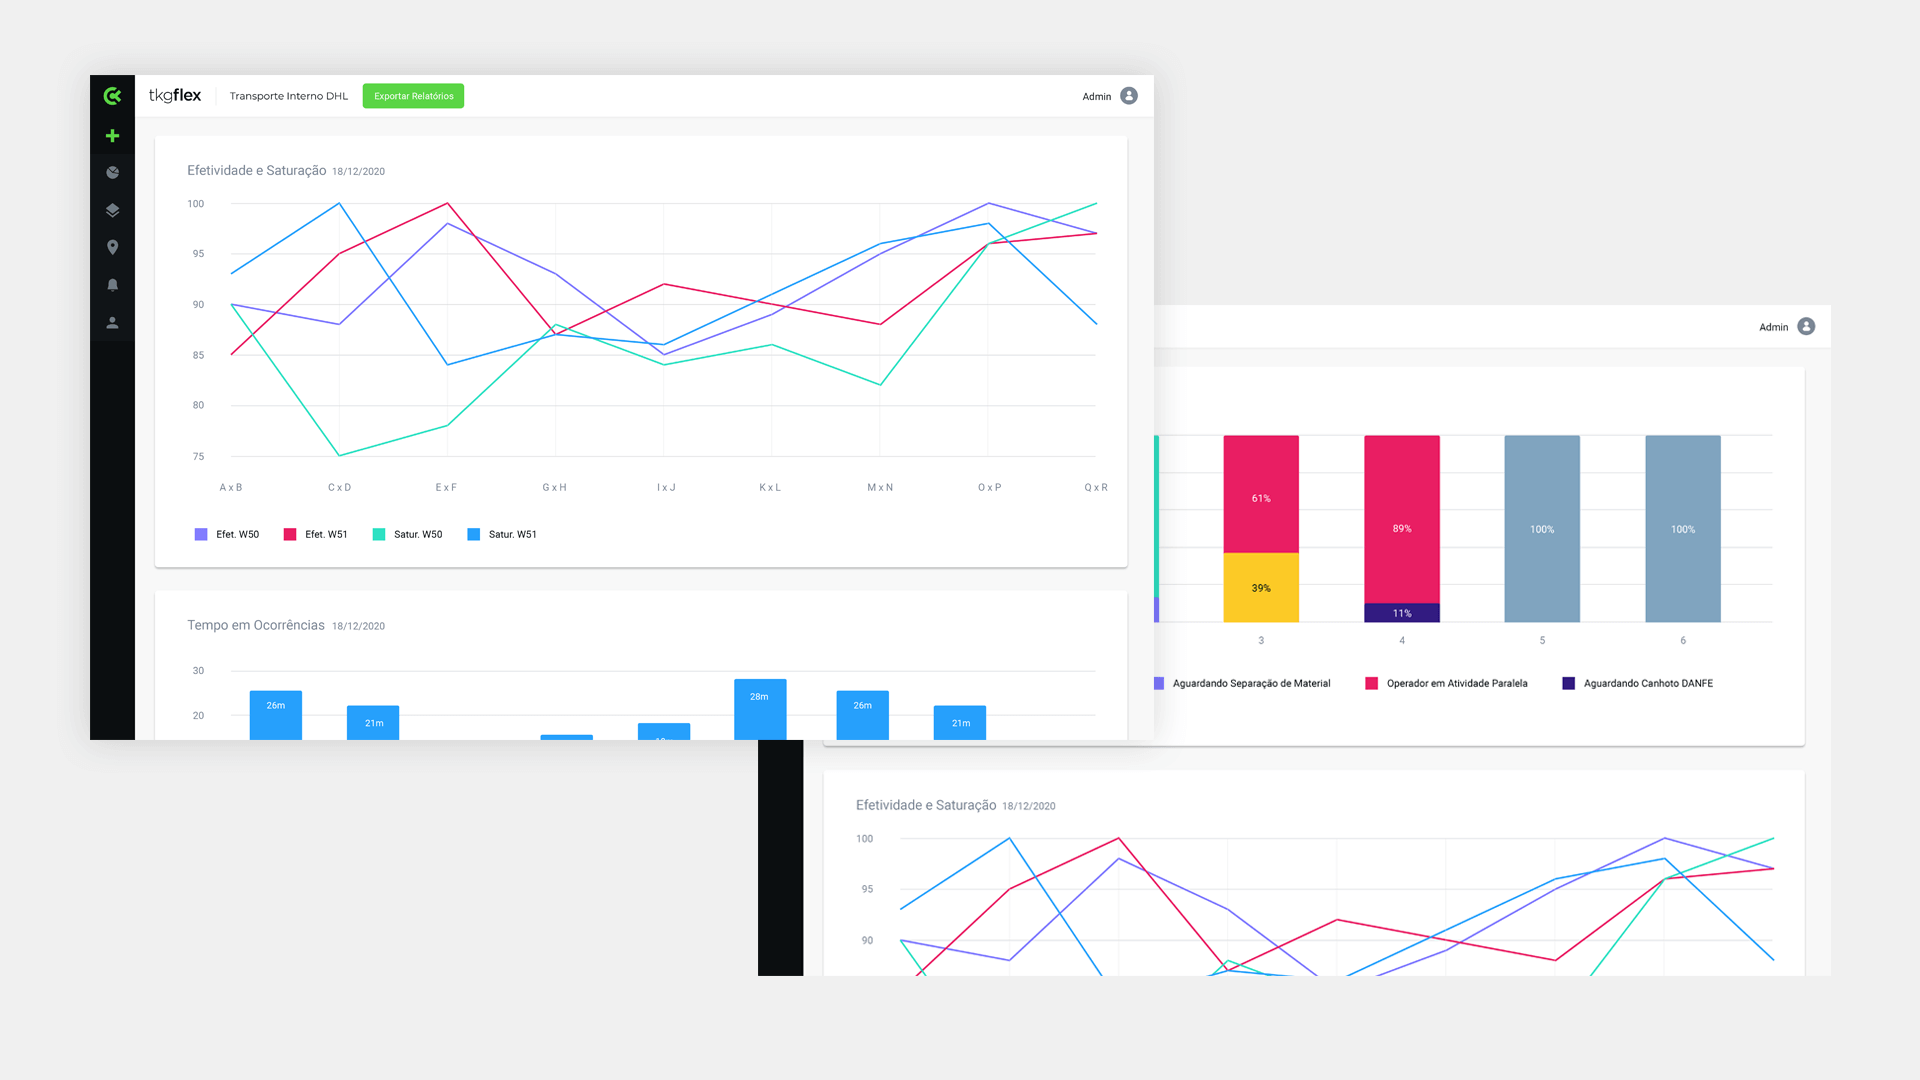
• Developing customized dashboards to meet specific operational and management needs.
• Intuitive data visualizations, including graphs, tables, and maps, for easy interpretation.
Goals
• Replacement of legacy software with anticipated technical enhancements.
• Development of key performance indicators for operations and management, aligning with current demands.
• The current sofwtare contract was nearing its end, and we had a very short deadline for development.
My Role
• Conducting research and UX/UI design.
Imersion
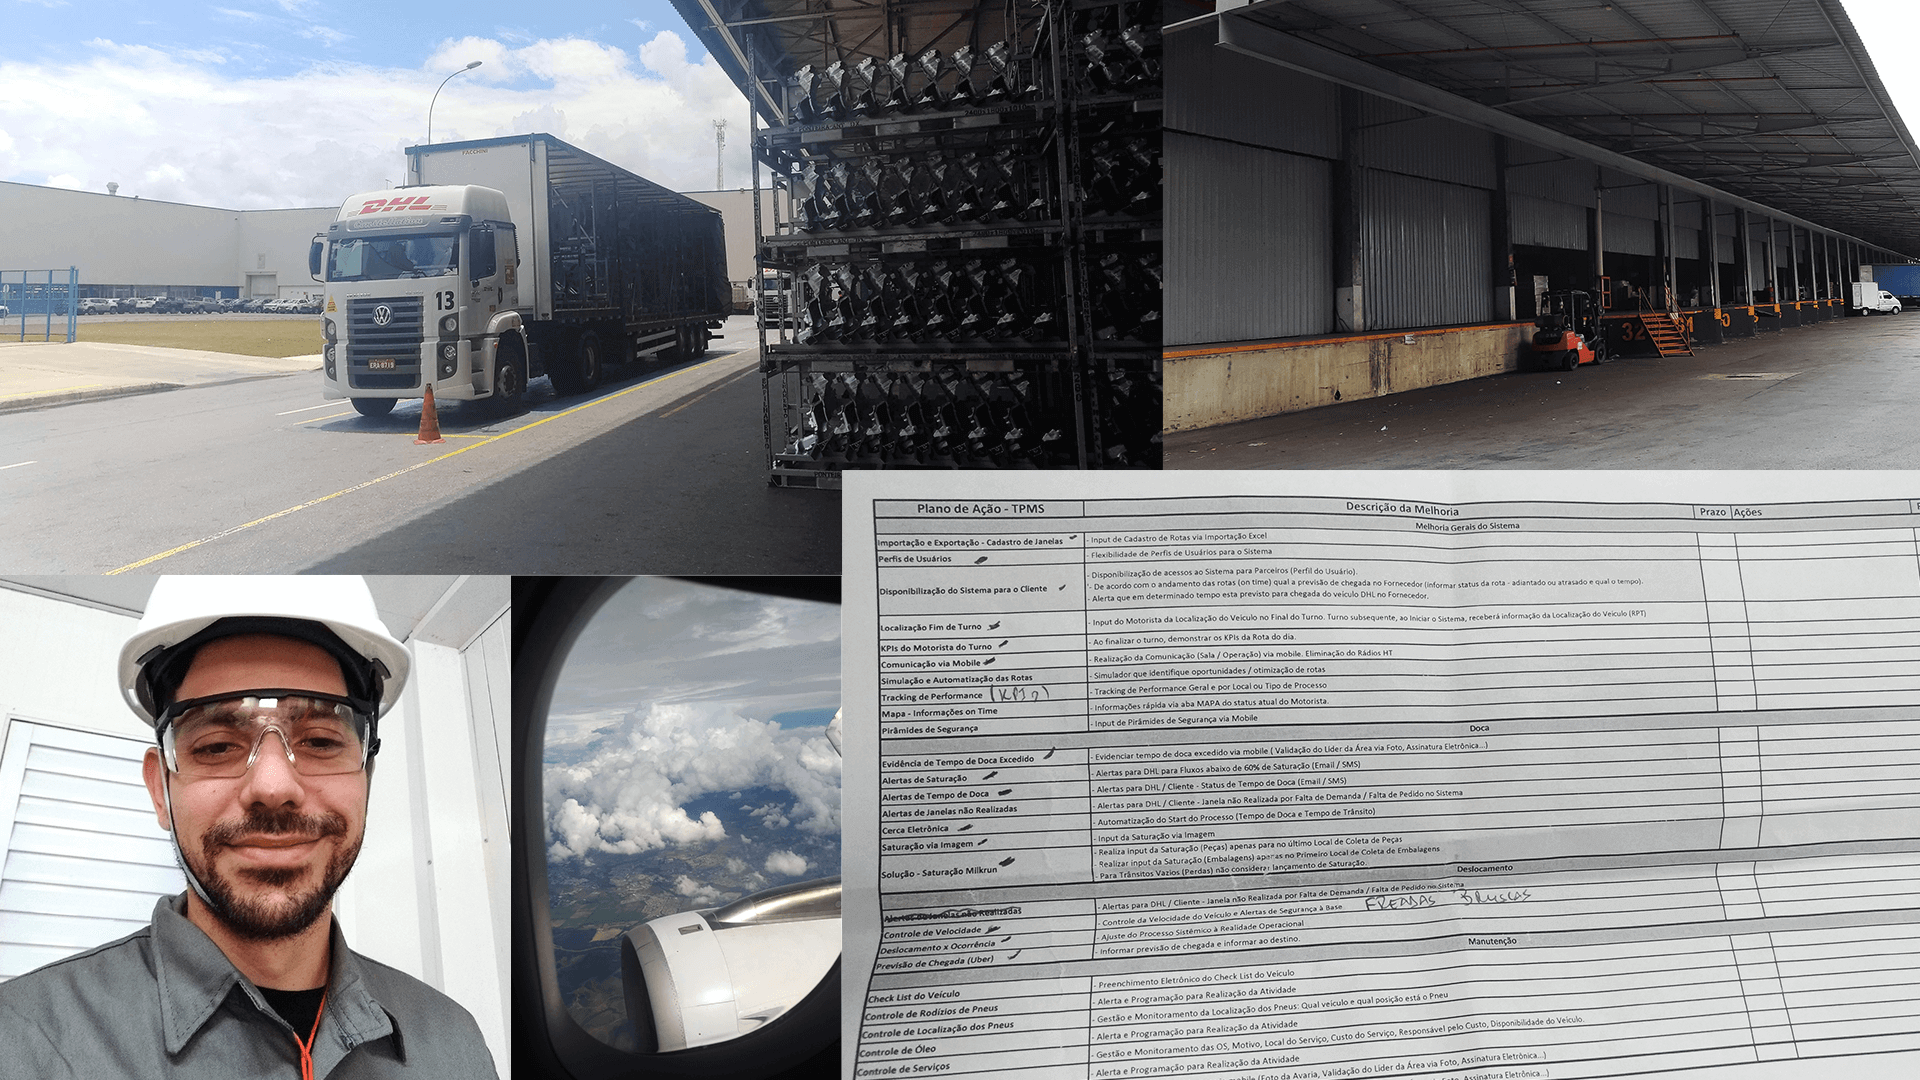
We visited the Jeep automotive hub to understand the logistics process, interacting with the operation manager, system users, and drivers.
Duration: 4 days of immersion - 14 interviews
We gained insight not only into the process but also into the current software architecture. Additionally, we understood which indicators would truly make sense for the operation.
Insights
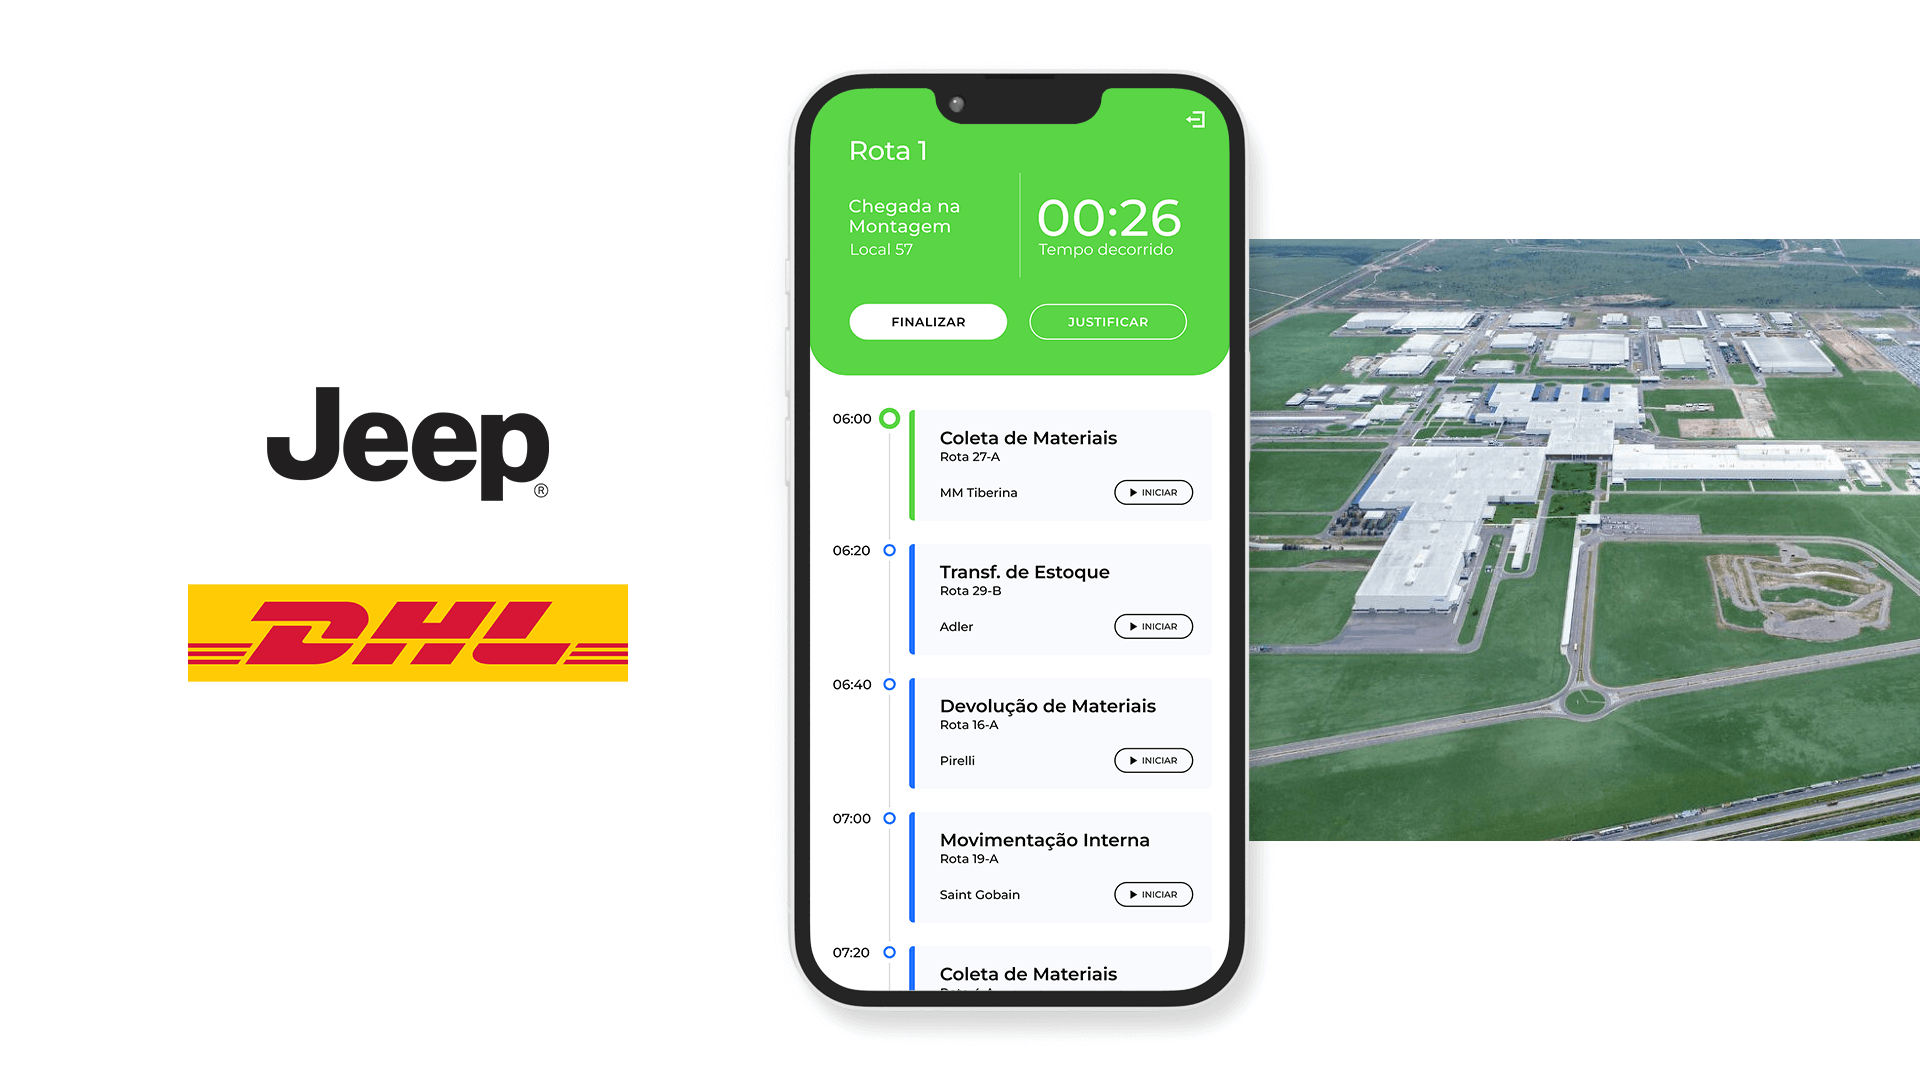
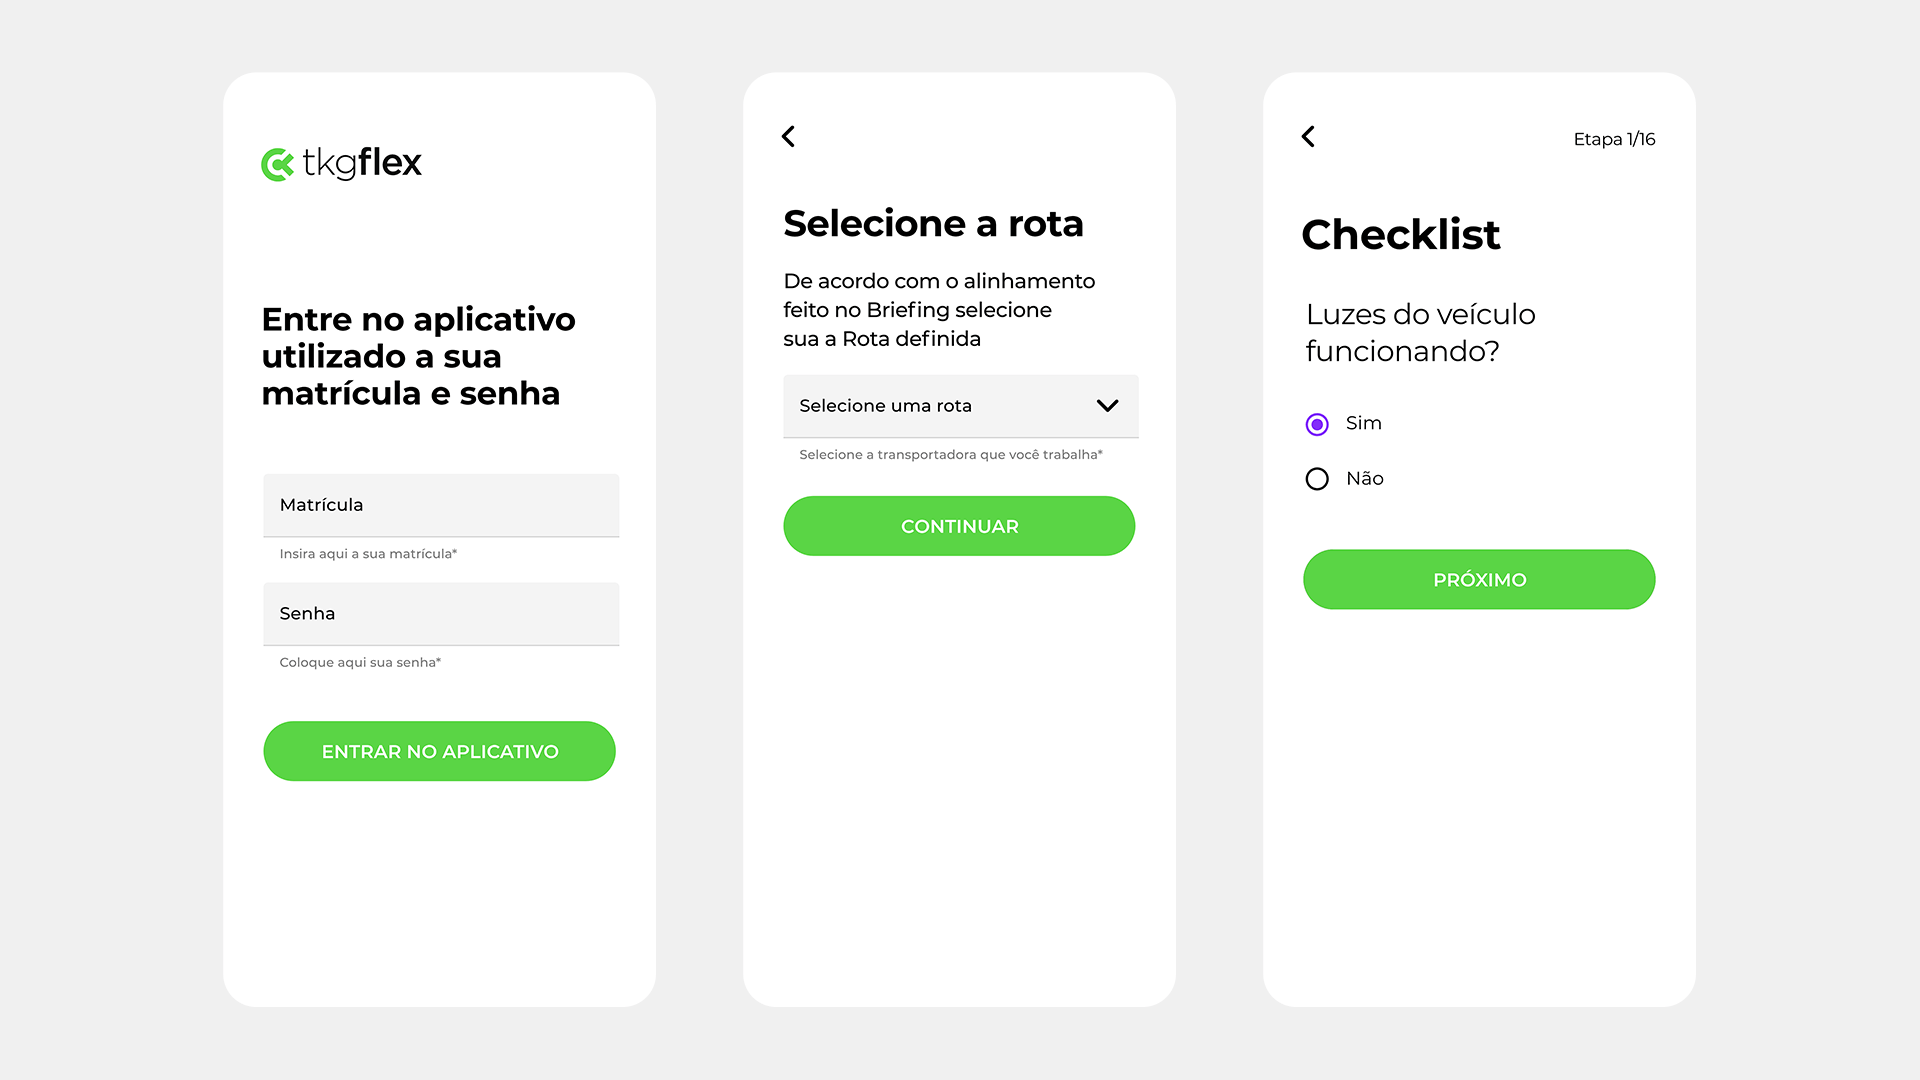
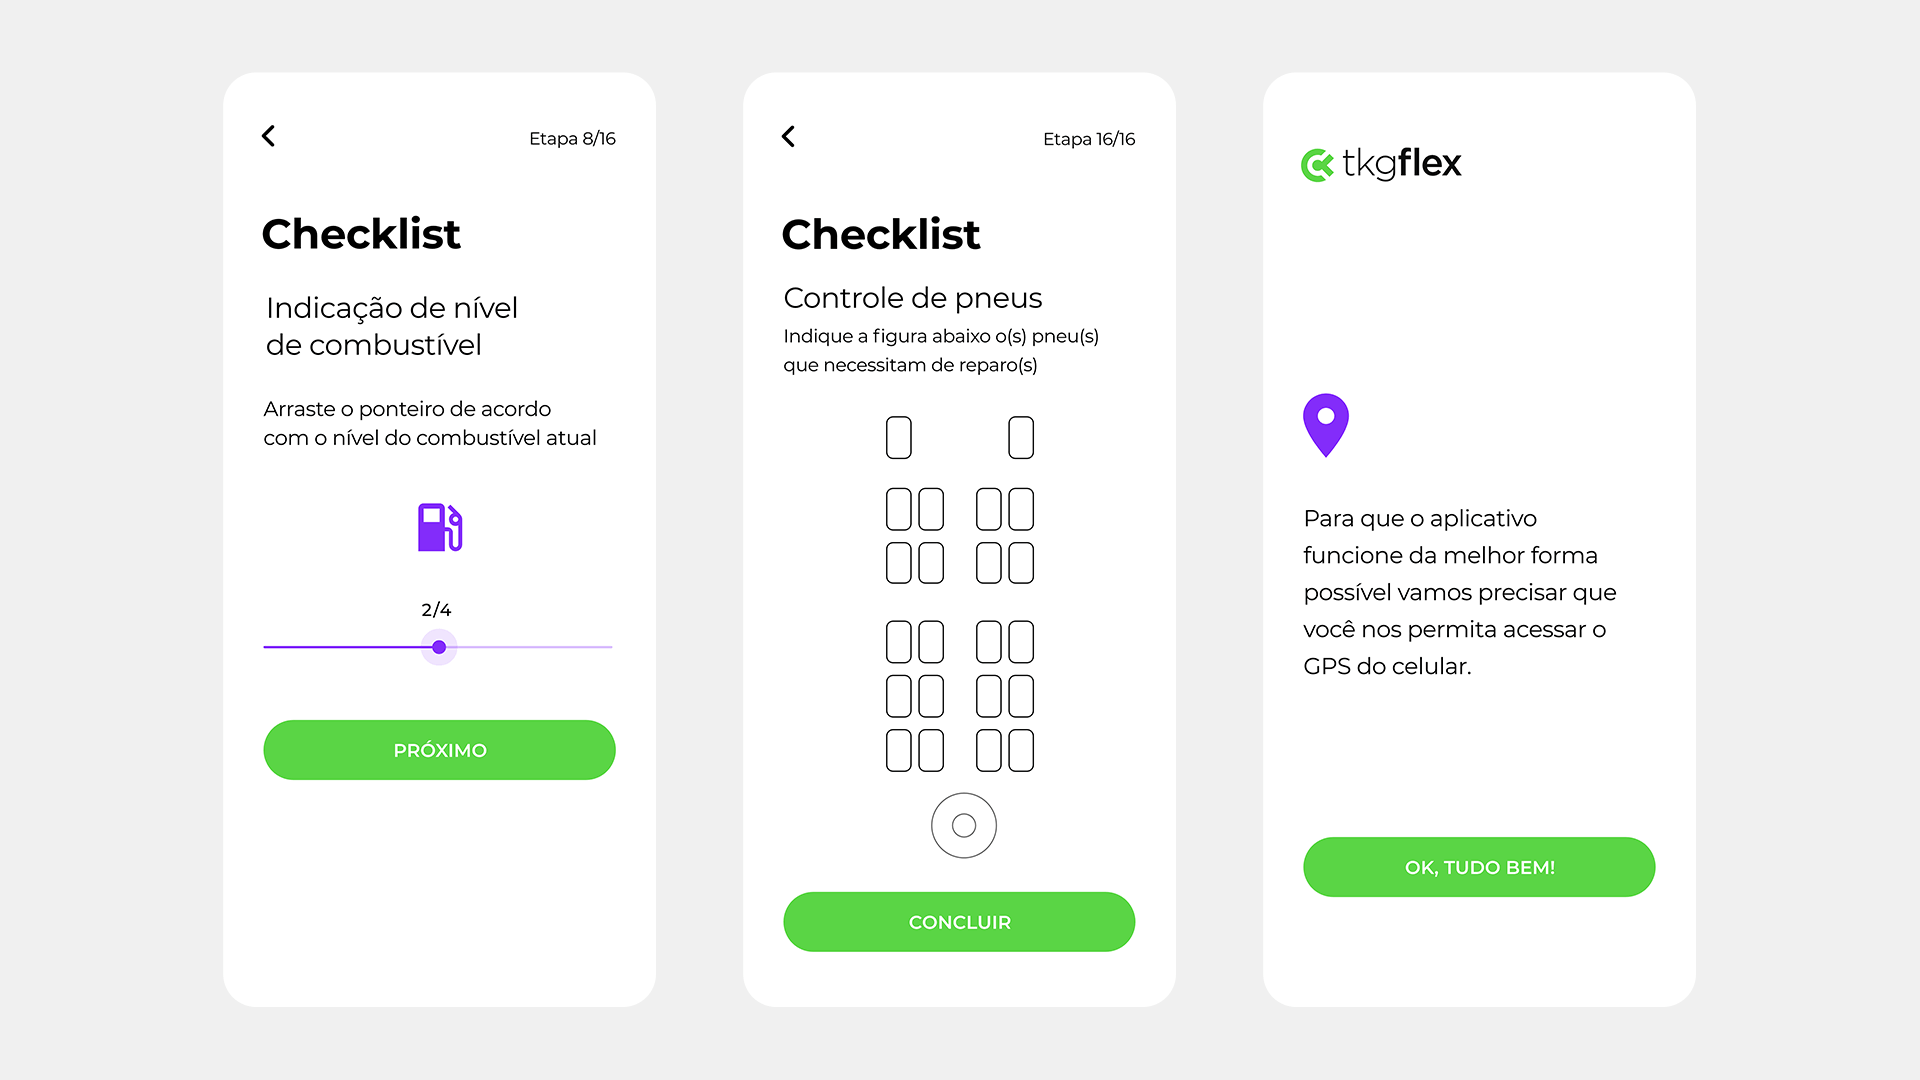
Driver App
• Route timing could be tracked without human interaction, utilizing geofencing and smartphone GPS.
• The morning checklist completed by drivers on paper often got lost; integrating it into the application was suggested.
• The operation proposed that trailer occupancy could be monitored using computer vision, though this was seen as a secondary demand.
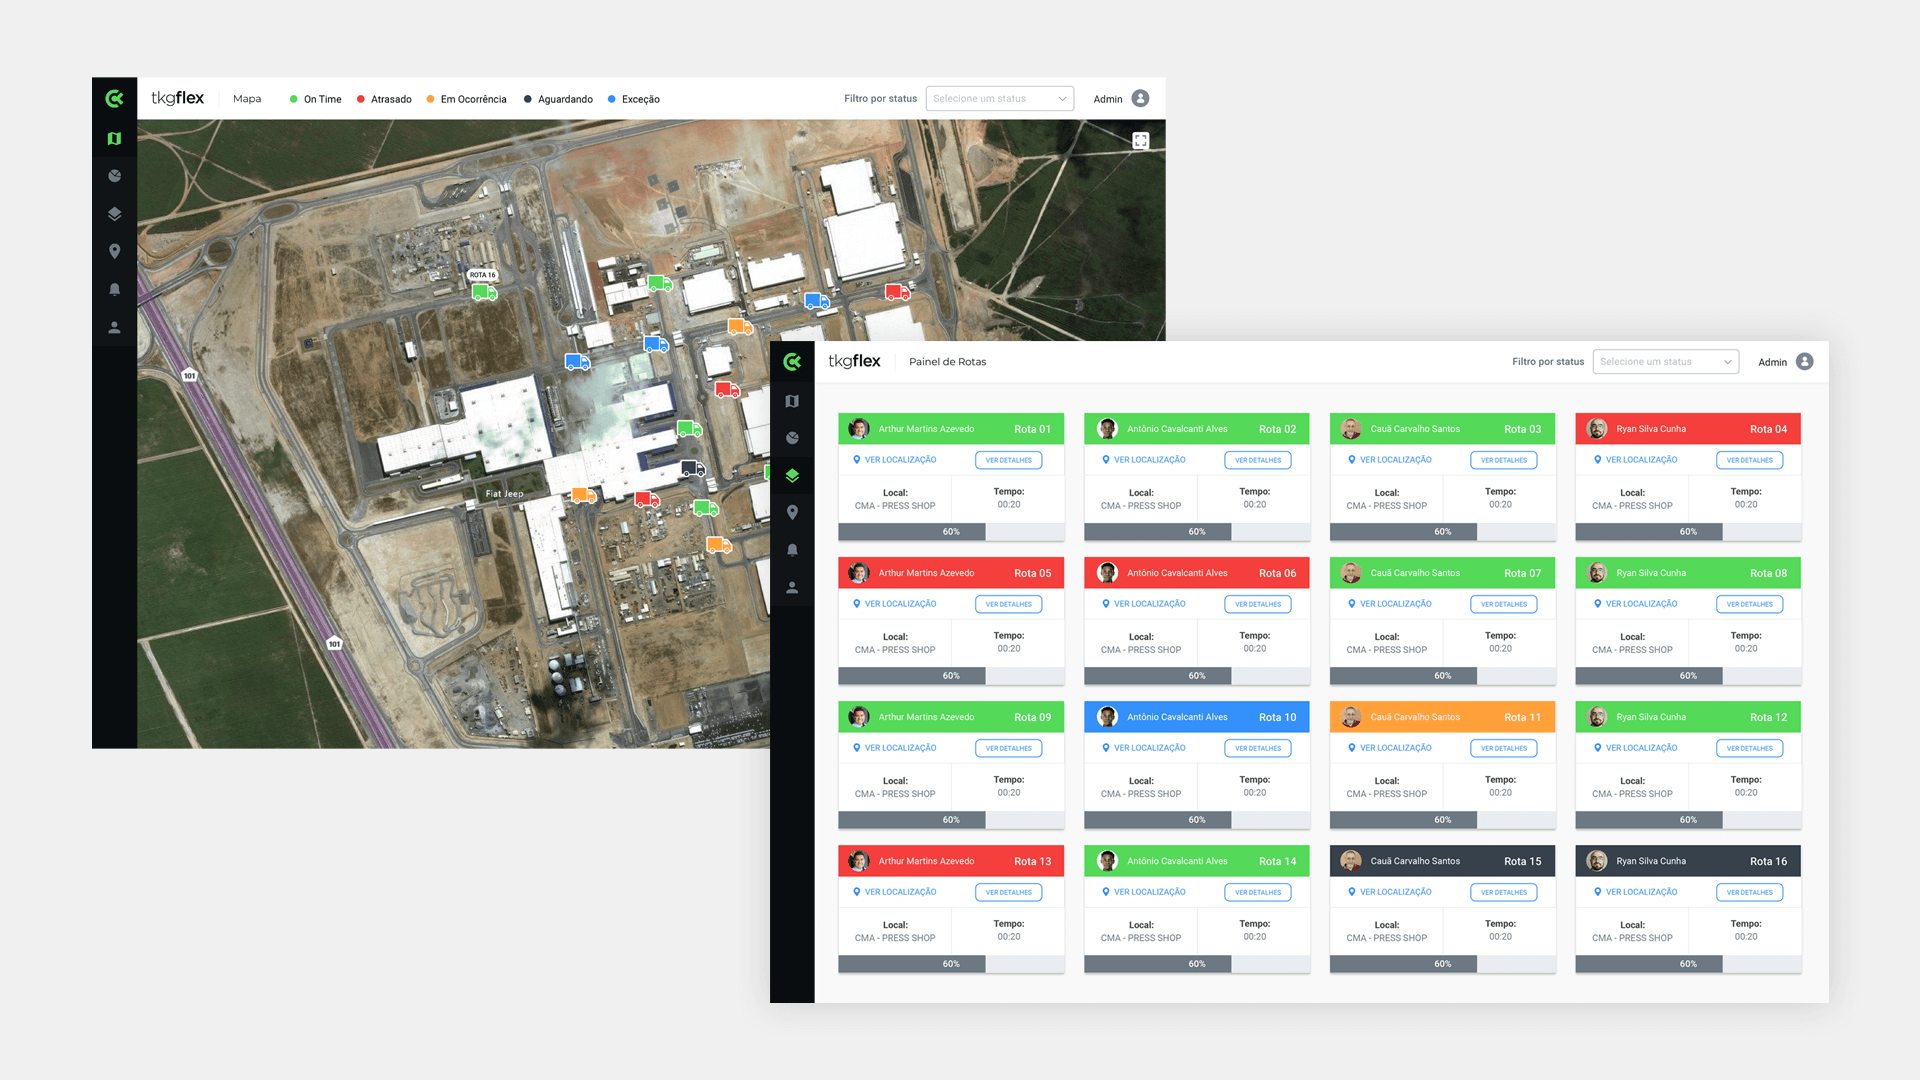
Milk Run Management System
• The operations team felt more comfortable creating routes in Excel spreadsheets, indicating poor usability of the current software. Thus, they preferred to use Excel and then import the data into the system rather than creating routes directly in the system.
Dashboards
• While the current dashboards were numerous, they didn't aid short- and medium-term decision-making. Part of this issue stemmed from how the information was presented. For instance, in some cases, a map displaying vehicle locations proved more effective than a graph. No study had been conducted on operational versus managerial dashboards. Once this distinction was understood, it became easier to proceed to the next stages.
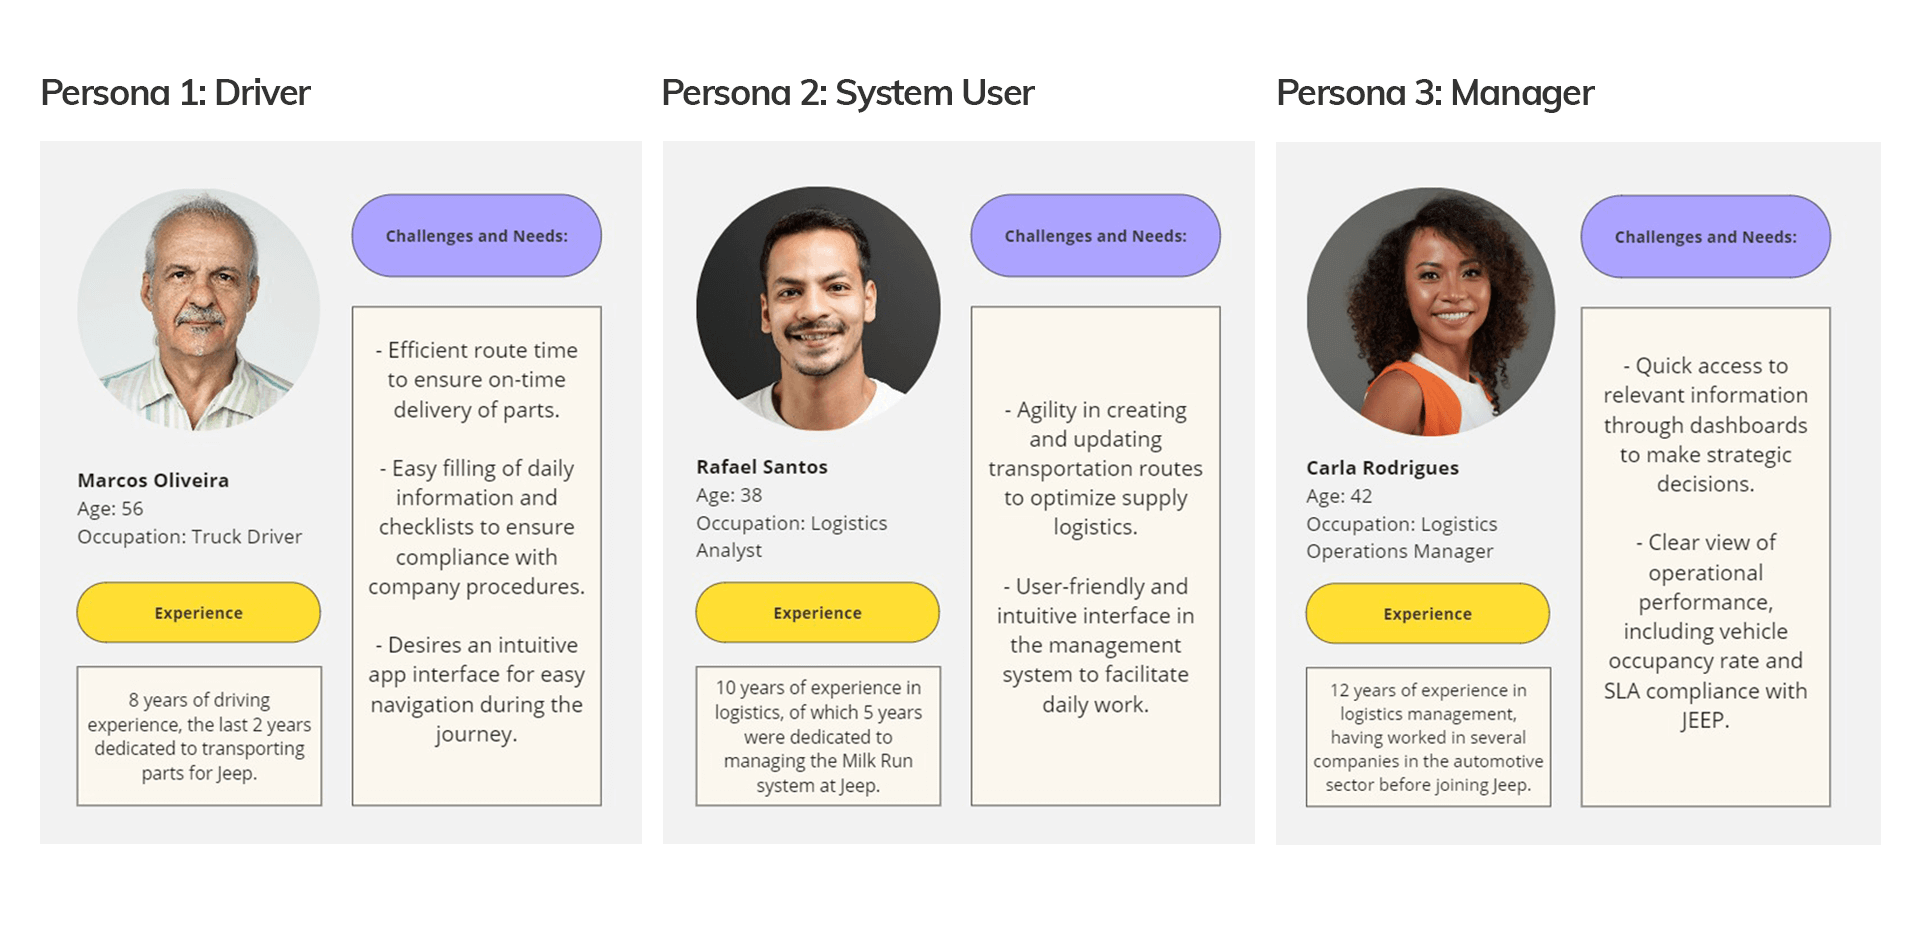
Personas
Three personas were identified in the solution's usage:
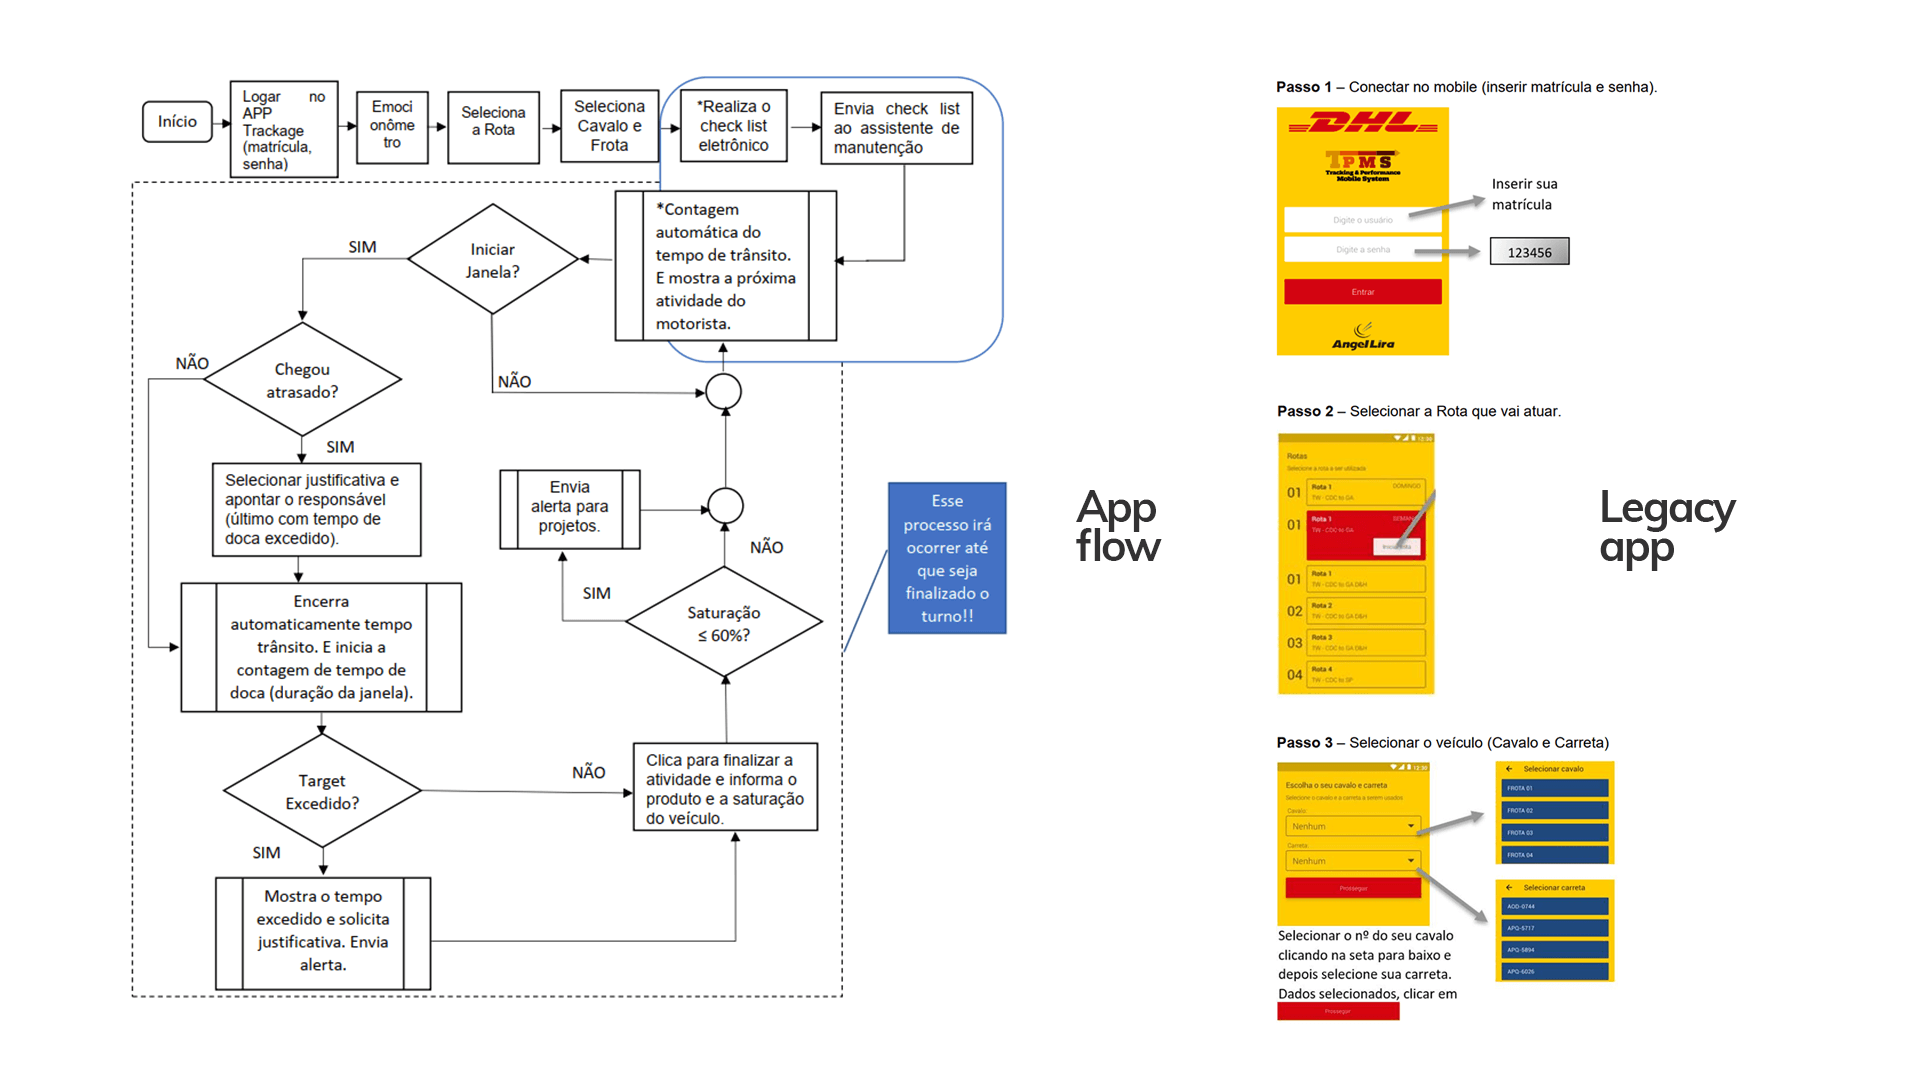
Requirements Discovery
Following the technical visit, the process of gathering technical requirements began, requiring a deep understanding of the operational system and the logistics flow.
Prototyping
Following the requirements gathering phase, we embarked on creating prototypes. Our goal for the new interface extended beyond a mere redesign of the existing solution; we aimed to deliver an enhanced user experience by addressing pain points that had previously hindered system usability. Given the tight deadlines and the need for swift action from both drivers and web system users, our interface design prioritized intuitiveness and rapid execution.
Regarding Key Performance Indicators (KPIs), we conducted thorough analysis. We delved into the meaning behind each indicator, collaborated with teams, and introduced new ways to present them. The result was clearer, more accessible information for users, facilitating informed decision-making.

Outcomes
Improvement of 40% in Internal Processes:
• Workflow Optimization: Streamlining workflows to enhance efficiency.
• Team Productivity Boost: Increasing team productivity.
• Error Reduction: Minimizing errors and rework.
Enhanced Efficiency:
• Waste Reduction: Cutting down on time, materials, and other resources.
• Optimized Tool Usage: Maximizing the effectiveness of tools and systems.
Meeting SLAs (Service Level Agreements):
• Adherence to Agreed Deadlines: Ensuring timely delivery.
• Service Quality Assurance: Providing high-quality services.
Learnings
On-Site Exploration: The significance of going into the field, spending time in operations, and truly understanding the client cannot be overstated. This approach was crucial for project success, as it allowed us to observe critical factors that could only be discerned up close.
Persona Understanding: Before devising solutions, we delved deeply into understanding the user’s persona and context. Rather than jumping straight to solutions, we prioritized comprehending the user journey.
Small Design Solutions, Big Impact: Even minor design enhancements can significantly boost efficiency in an automotive production line. Given the stringent deadlines and the need for decisive action, these small design adjustments played a pivotal role.